
Characterizing T cell epitope loss potential through peptidome surveillance across evolving SARS-CoV-2 lineages
Supplementary information and interactive content to accompany published analysis of HLA binding of the SARS-CoV-2 peptidome across viral variants, and the impact on potential loss of CD8+ and CD4+ T-cell epitopes.
Our Frontiers in Immunology paper: https://www.frontiersin.org/articles/10.3389/fimmu.2022.918928/full
Binder count fraction at pan-HLA hotspots in most frequent S,N of VOC lineages
Interactive plots of binder count fraction relative to reference (NCBI Reference Sequence: NC_045512) at pan-HLA hotspots.

- B.1.1.7 (Alpha)
- B.1.351 (Beta)
- B.1.617.2 (Delta)
- P.1 (Gamma)
- B.1.1.529 (Omicron)
Distribution of binder count fraction at pan-HLA hotspots for VOC and VOI lineages
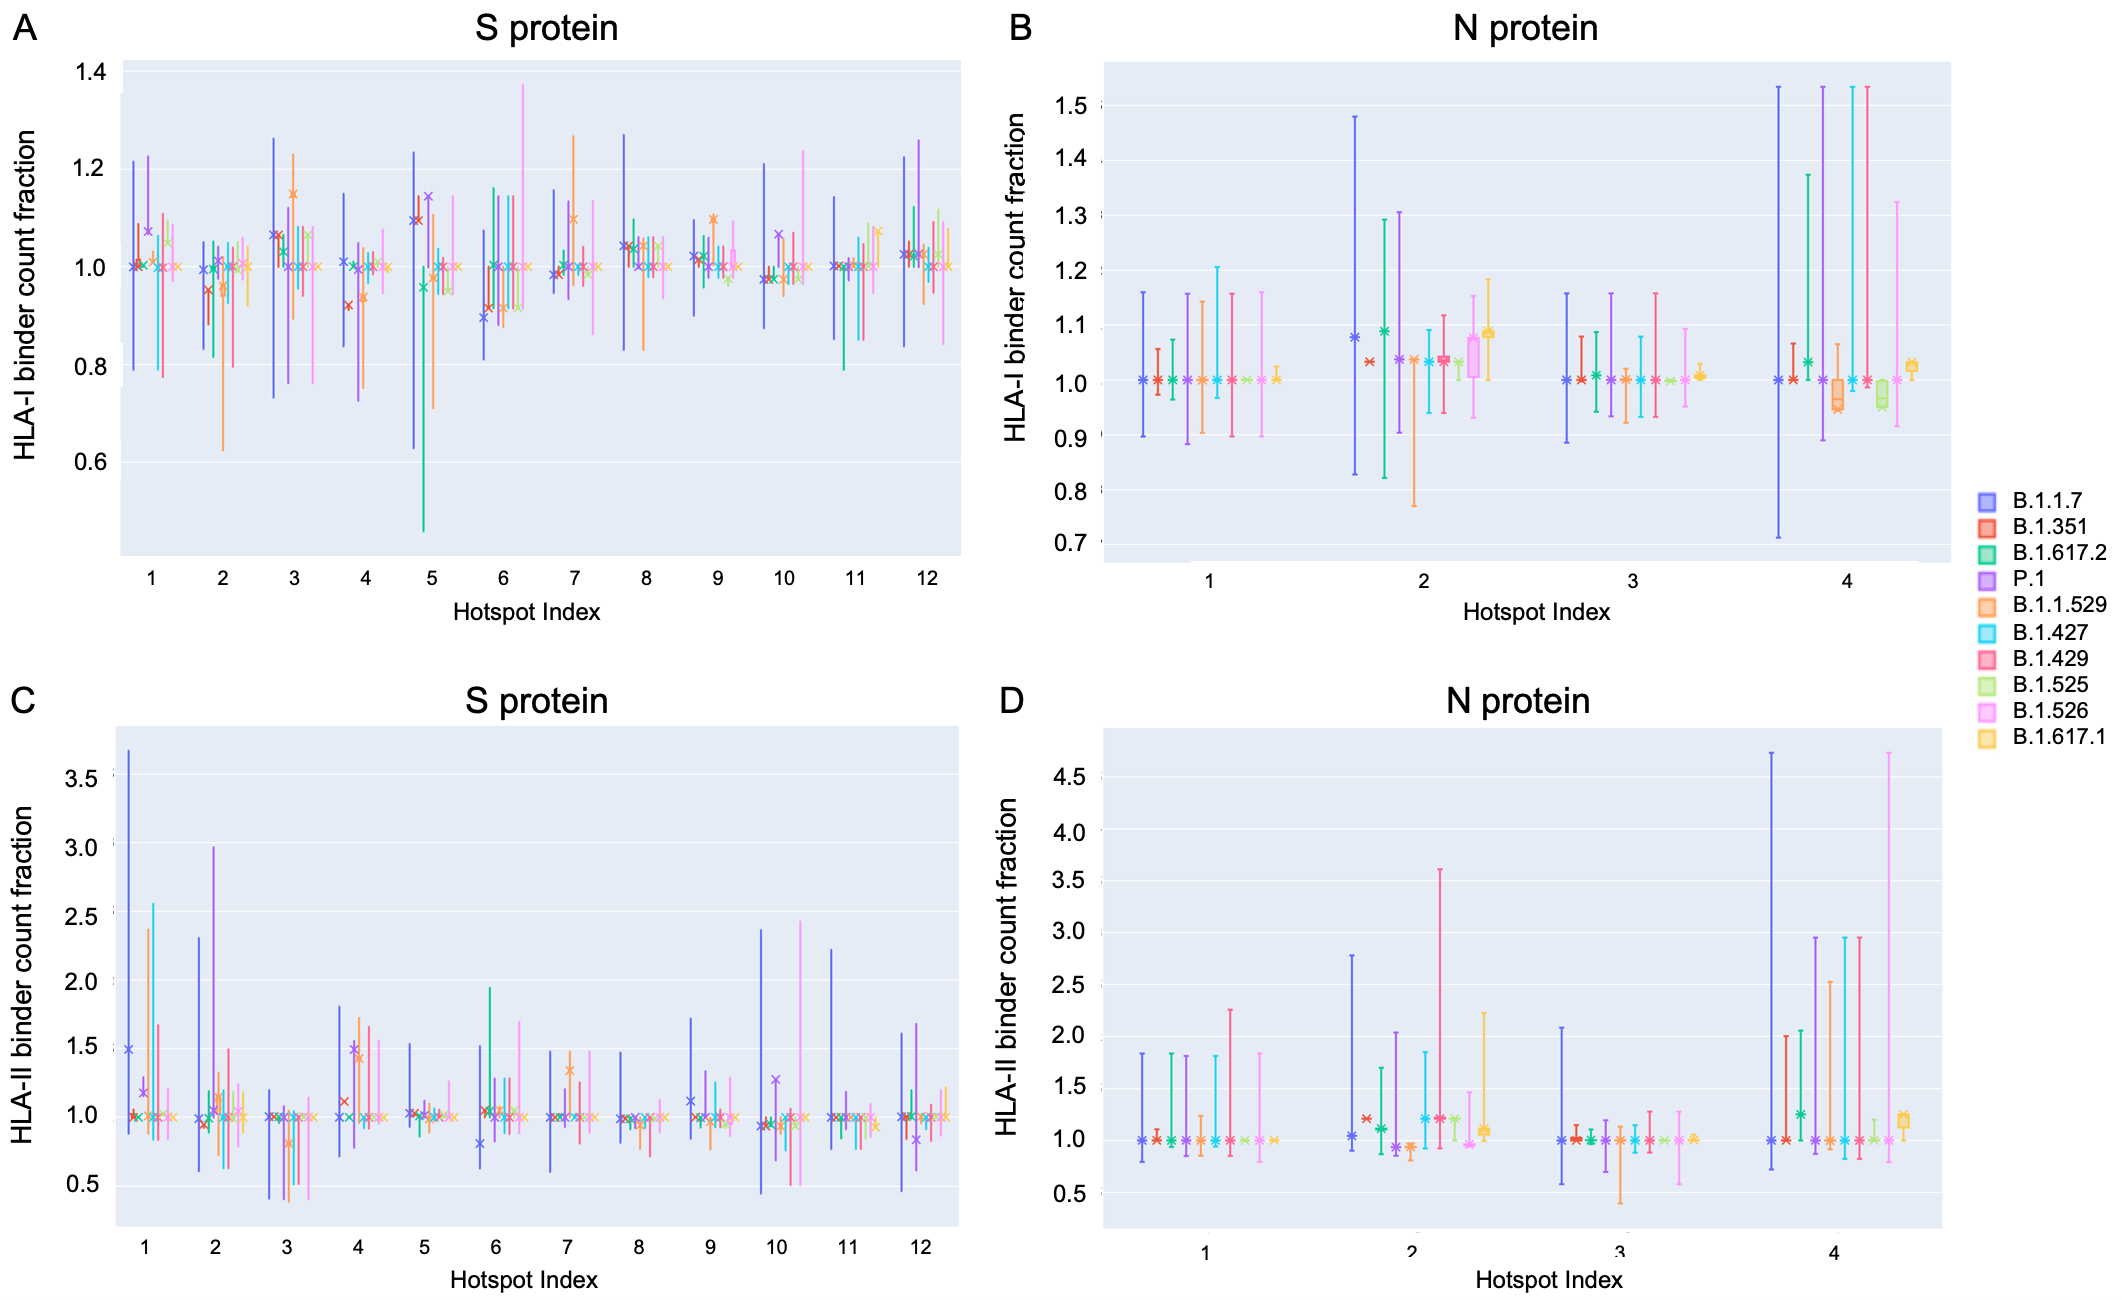
- S: HLA-I binder count fraction at pan-HLA hotspots (Fig. 9A)
- N: HLA-I binder count fraction at pan-HLA hotspots (Fig. 9B)
- S: HLA-II binder count fraction at pan-HLA hotspots (Fig. 9C)
- N: HLA-II binder count fraction at pan-HLA hotspots (Fig. 9D)
N candidate epitope conservation in SARS-CoV-2 lineages with representative S protein ranking in the top percent for HLA binder loss
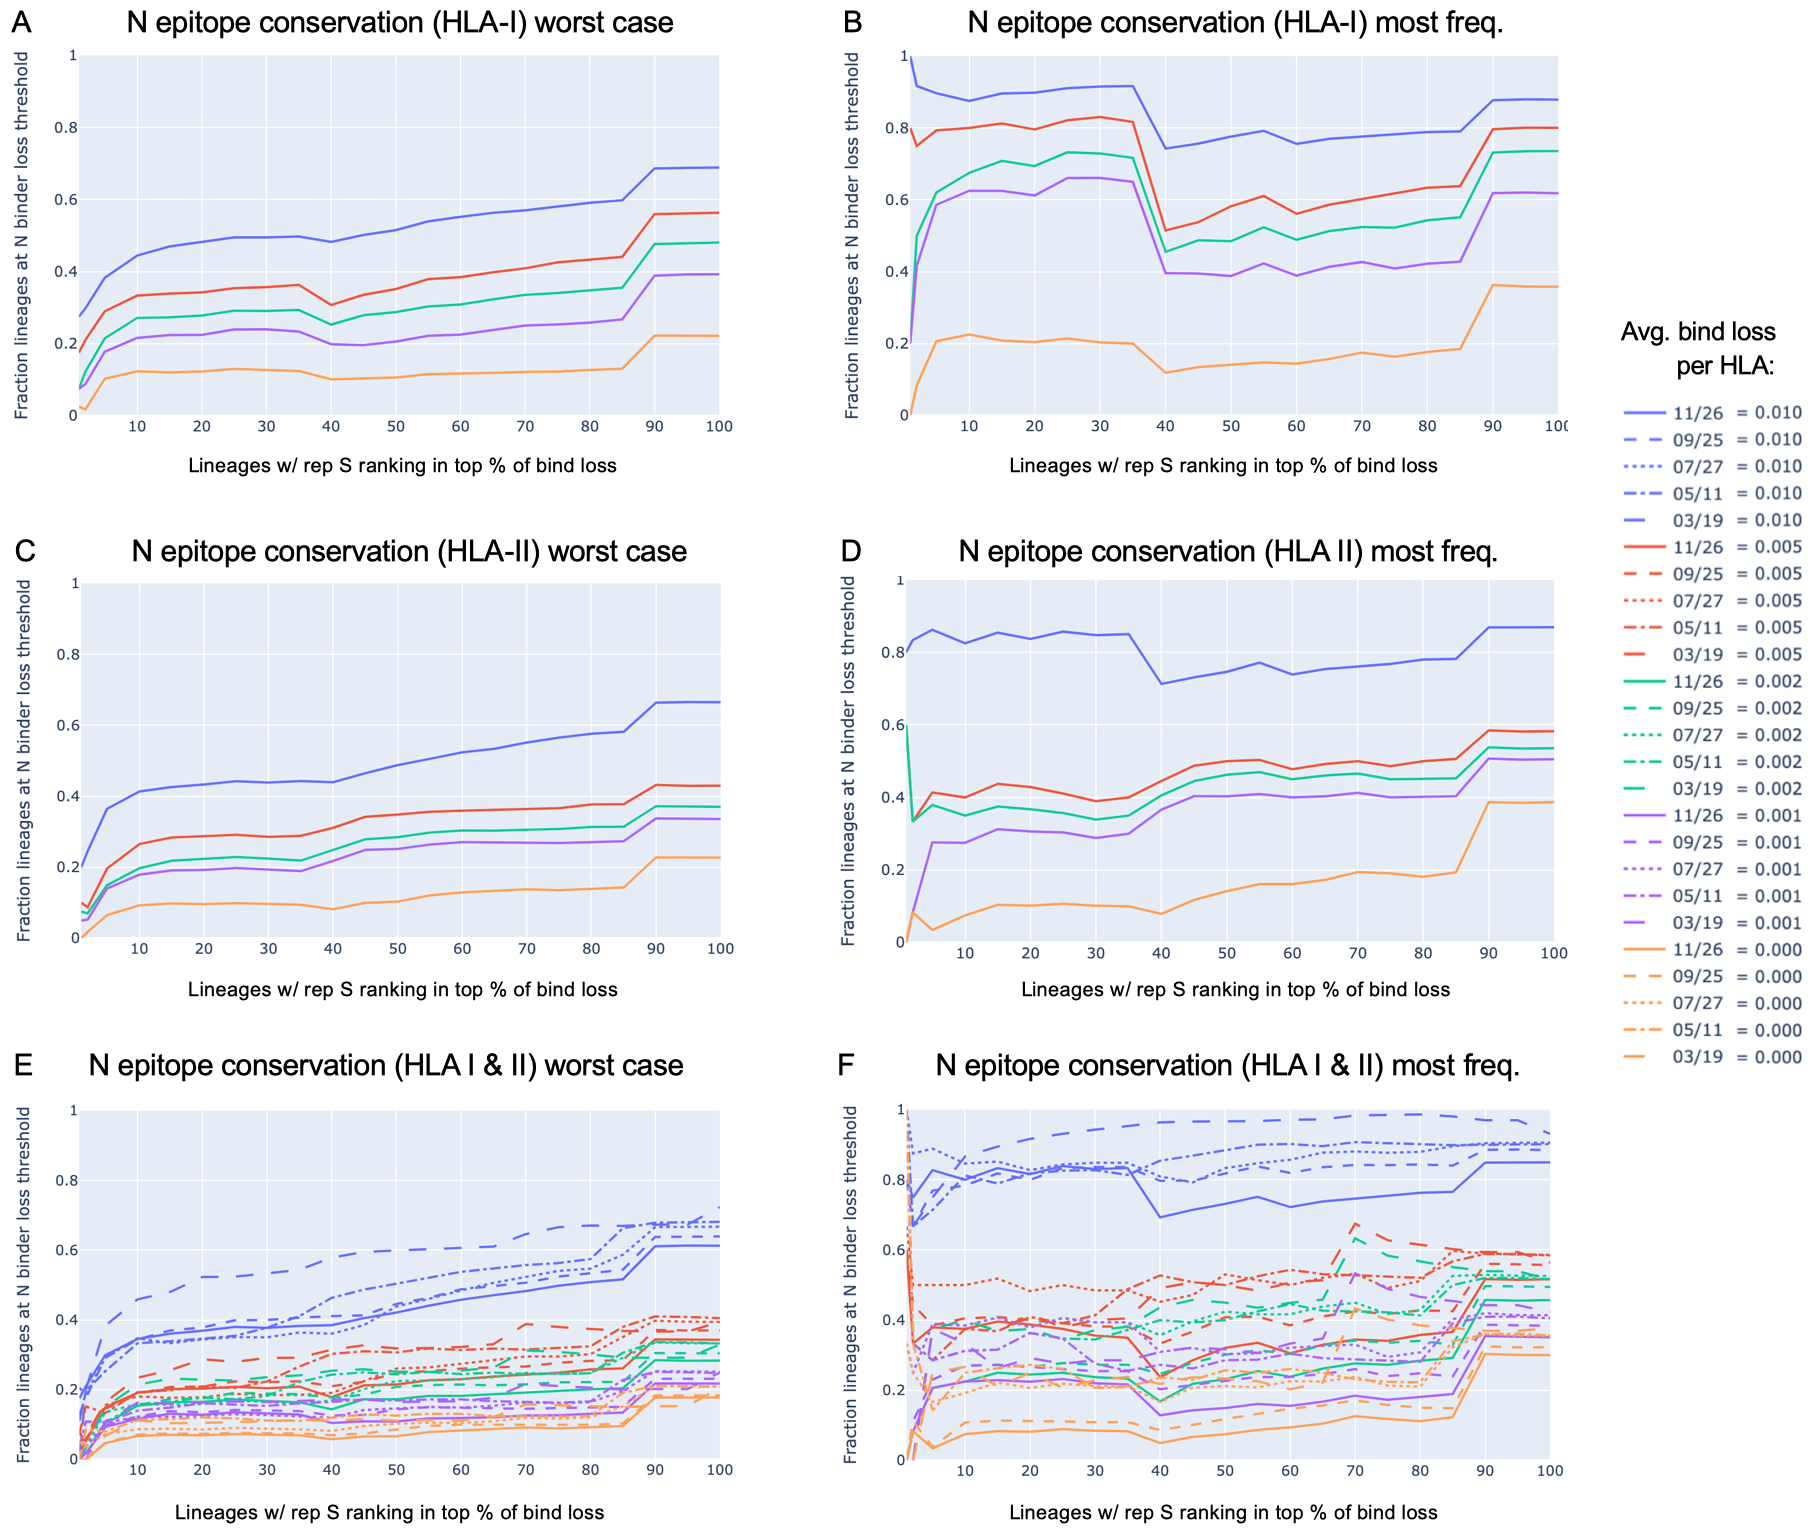
| restriction | worst case (most loss) protein | most frequent protein |
|---|---|---|
| HLA-I | Fig. 6A | Fig. 6B |
| HLA-II | Fig. 6C | Fig. 6D |
| HLA-I & HLA-II | Fig. 6E | Fig. 6F |
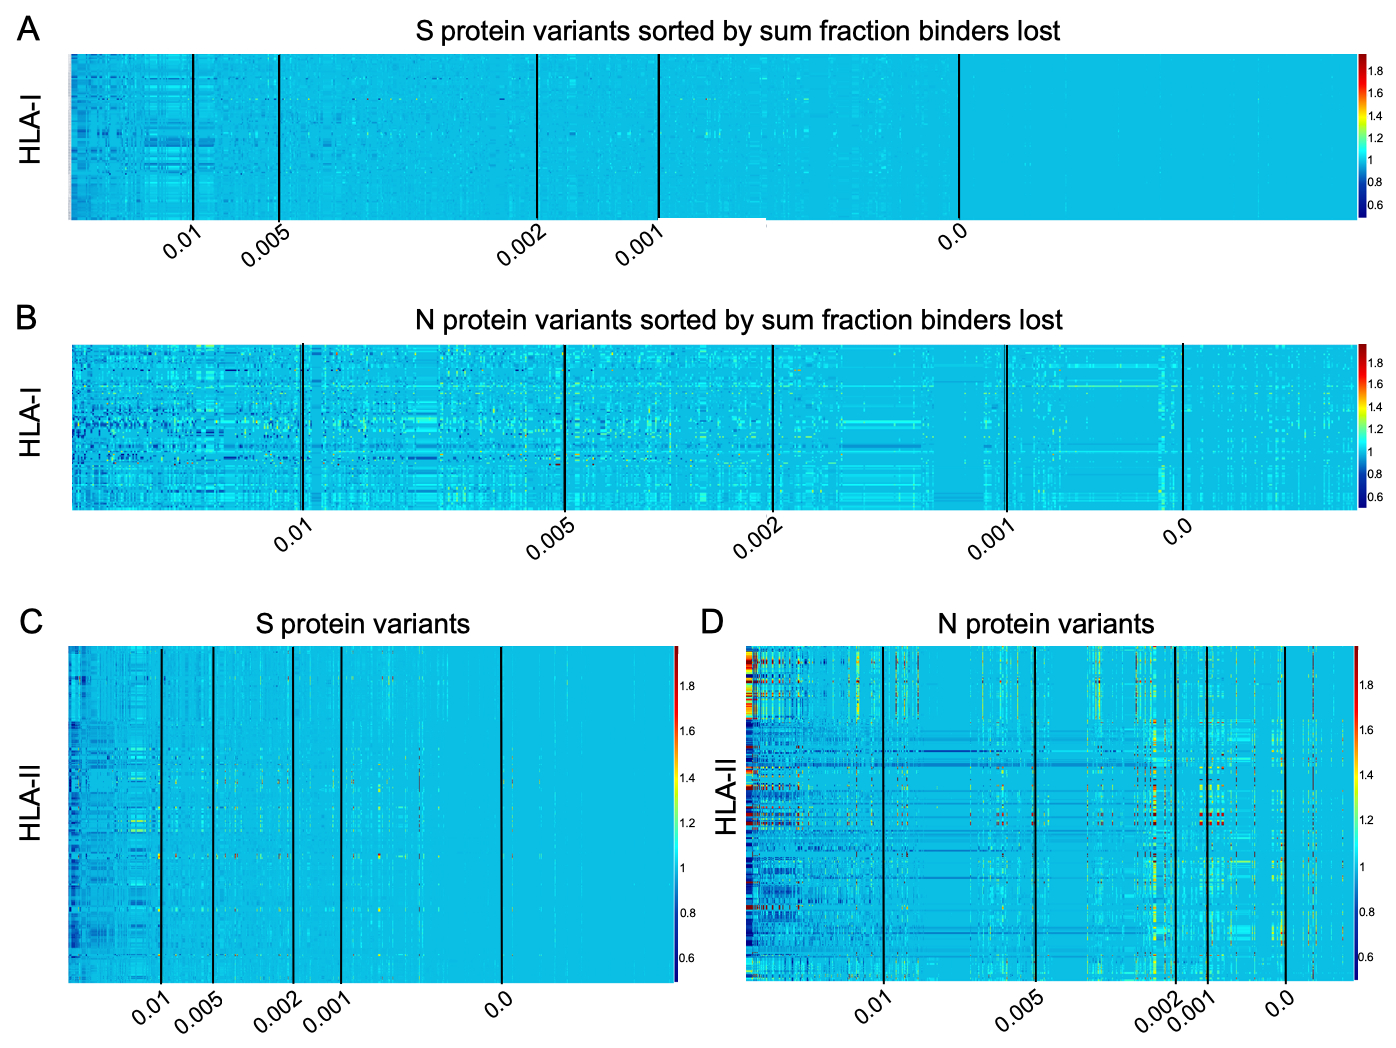
Binder count fraction for all HLAs across all unique versions of S and N
Note that, for each protein considered, binder count fraction (relative to the reference SARS-CoV-2 genome) is computed after summation of binder count across all pan-HLA hotspots. See Methods in paper for details.
| date | S, HLA-I | N, HLA-I | S, HLA-II | N, HLA-II |
|---|---|---|---|---|
| 11/26/2021 | plot | plot | plot | plot |
| 09/25/2021 | plot | plot | plot | plot |
| 07/27/2021 | plot | plot | plot | plot |
| 05/11/2021 | plot | plot | plot | plot |
| 03/19/2021 | Fig. 5A | Fig. 5B | Fig. 5C | Fig. 5D |
HLA cluster assignment and representative set selection
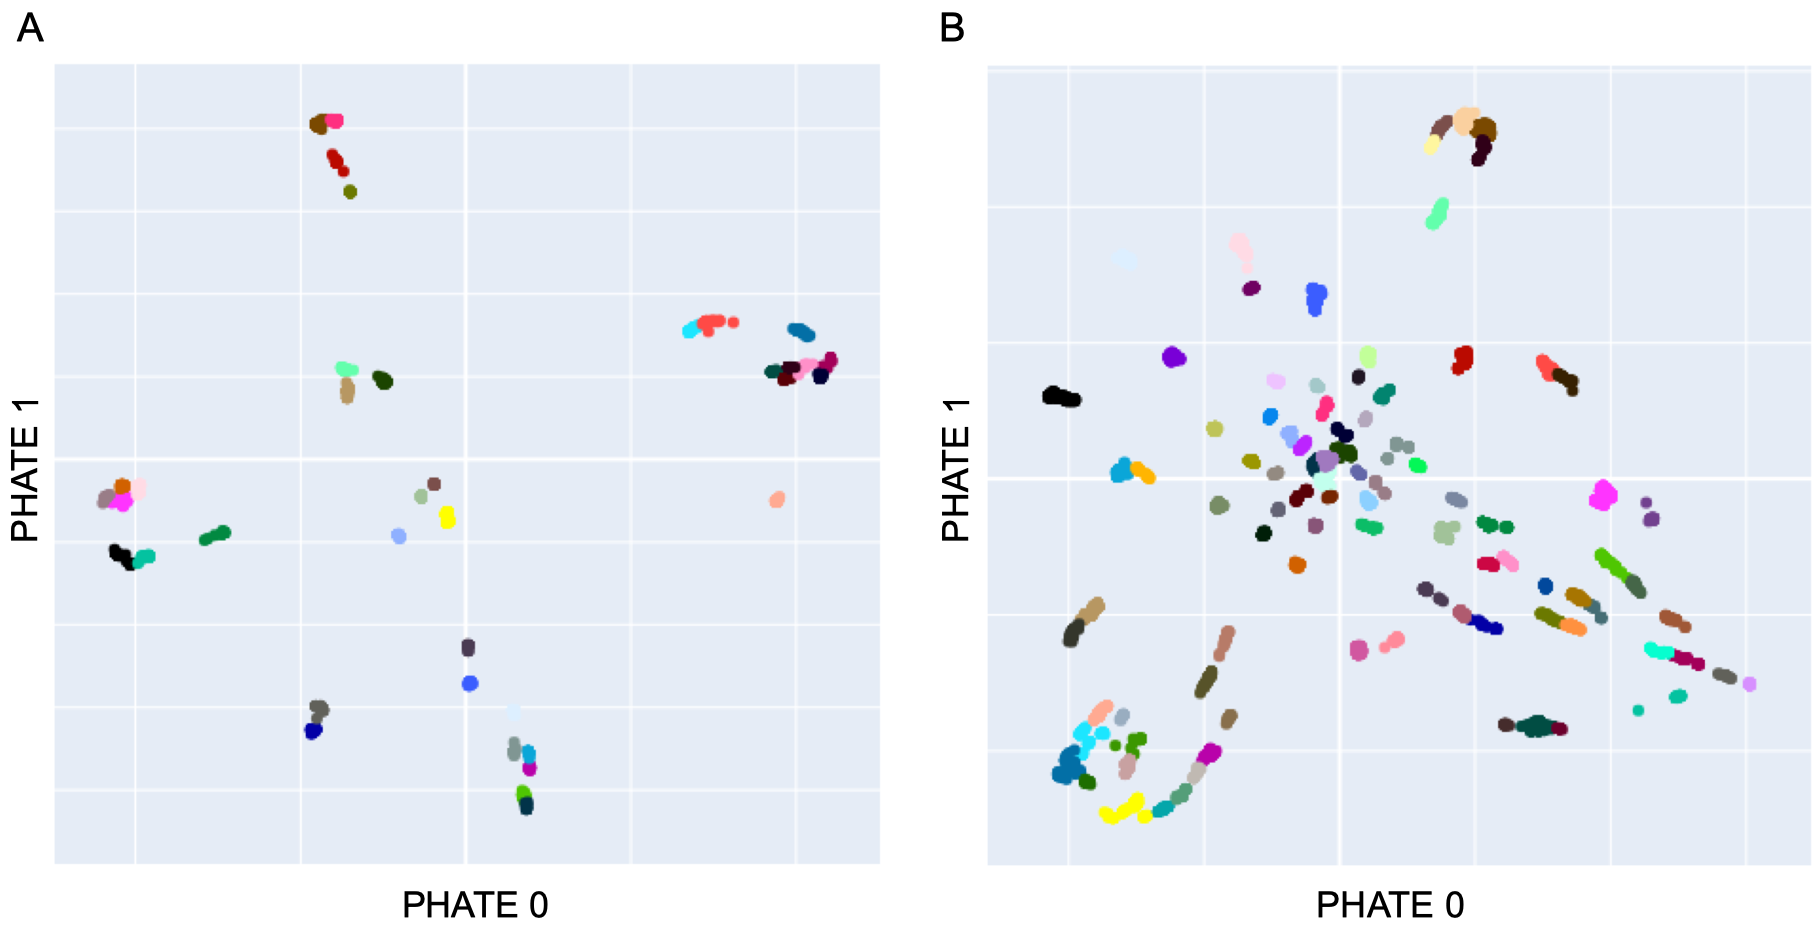
The .csv files below include our cluster label assignment for all processed HLA-I and HLA-II. Each file contains a column explicitly indicating which HLAs were included in our analysis set (selected in HLA-I, and selected_ab in HLA-II).
For quick browsing, interactive plots are also included below.
- Interavtive plots
- CSV files
Evaluation of Predictions
Empirically observed T-cell response frequencies (RF) align with aggregated HLA-binder peaks
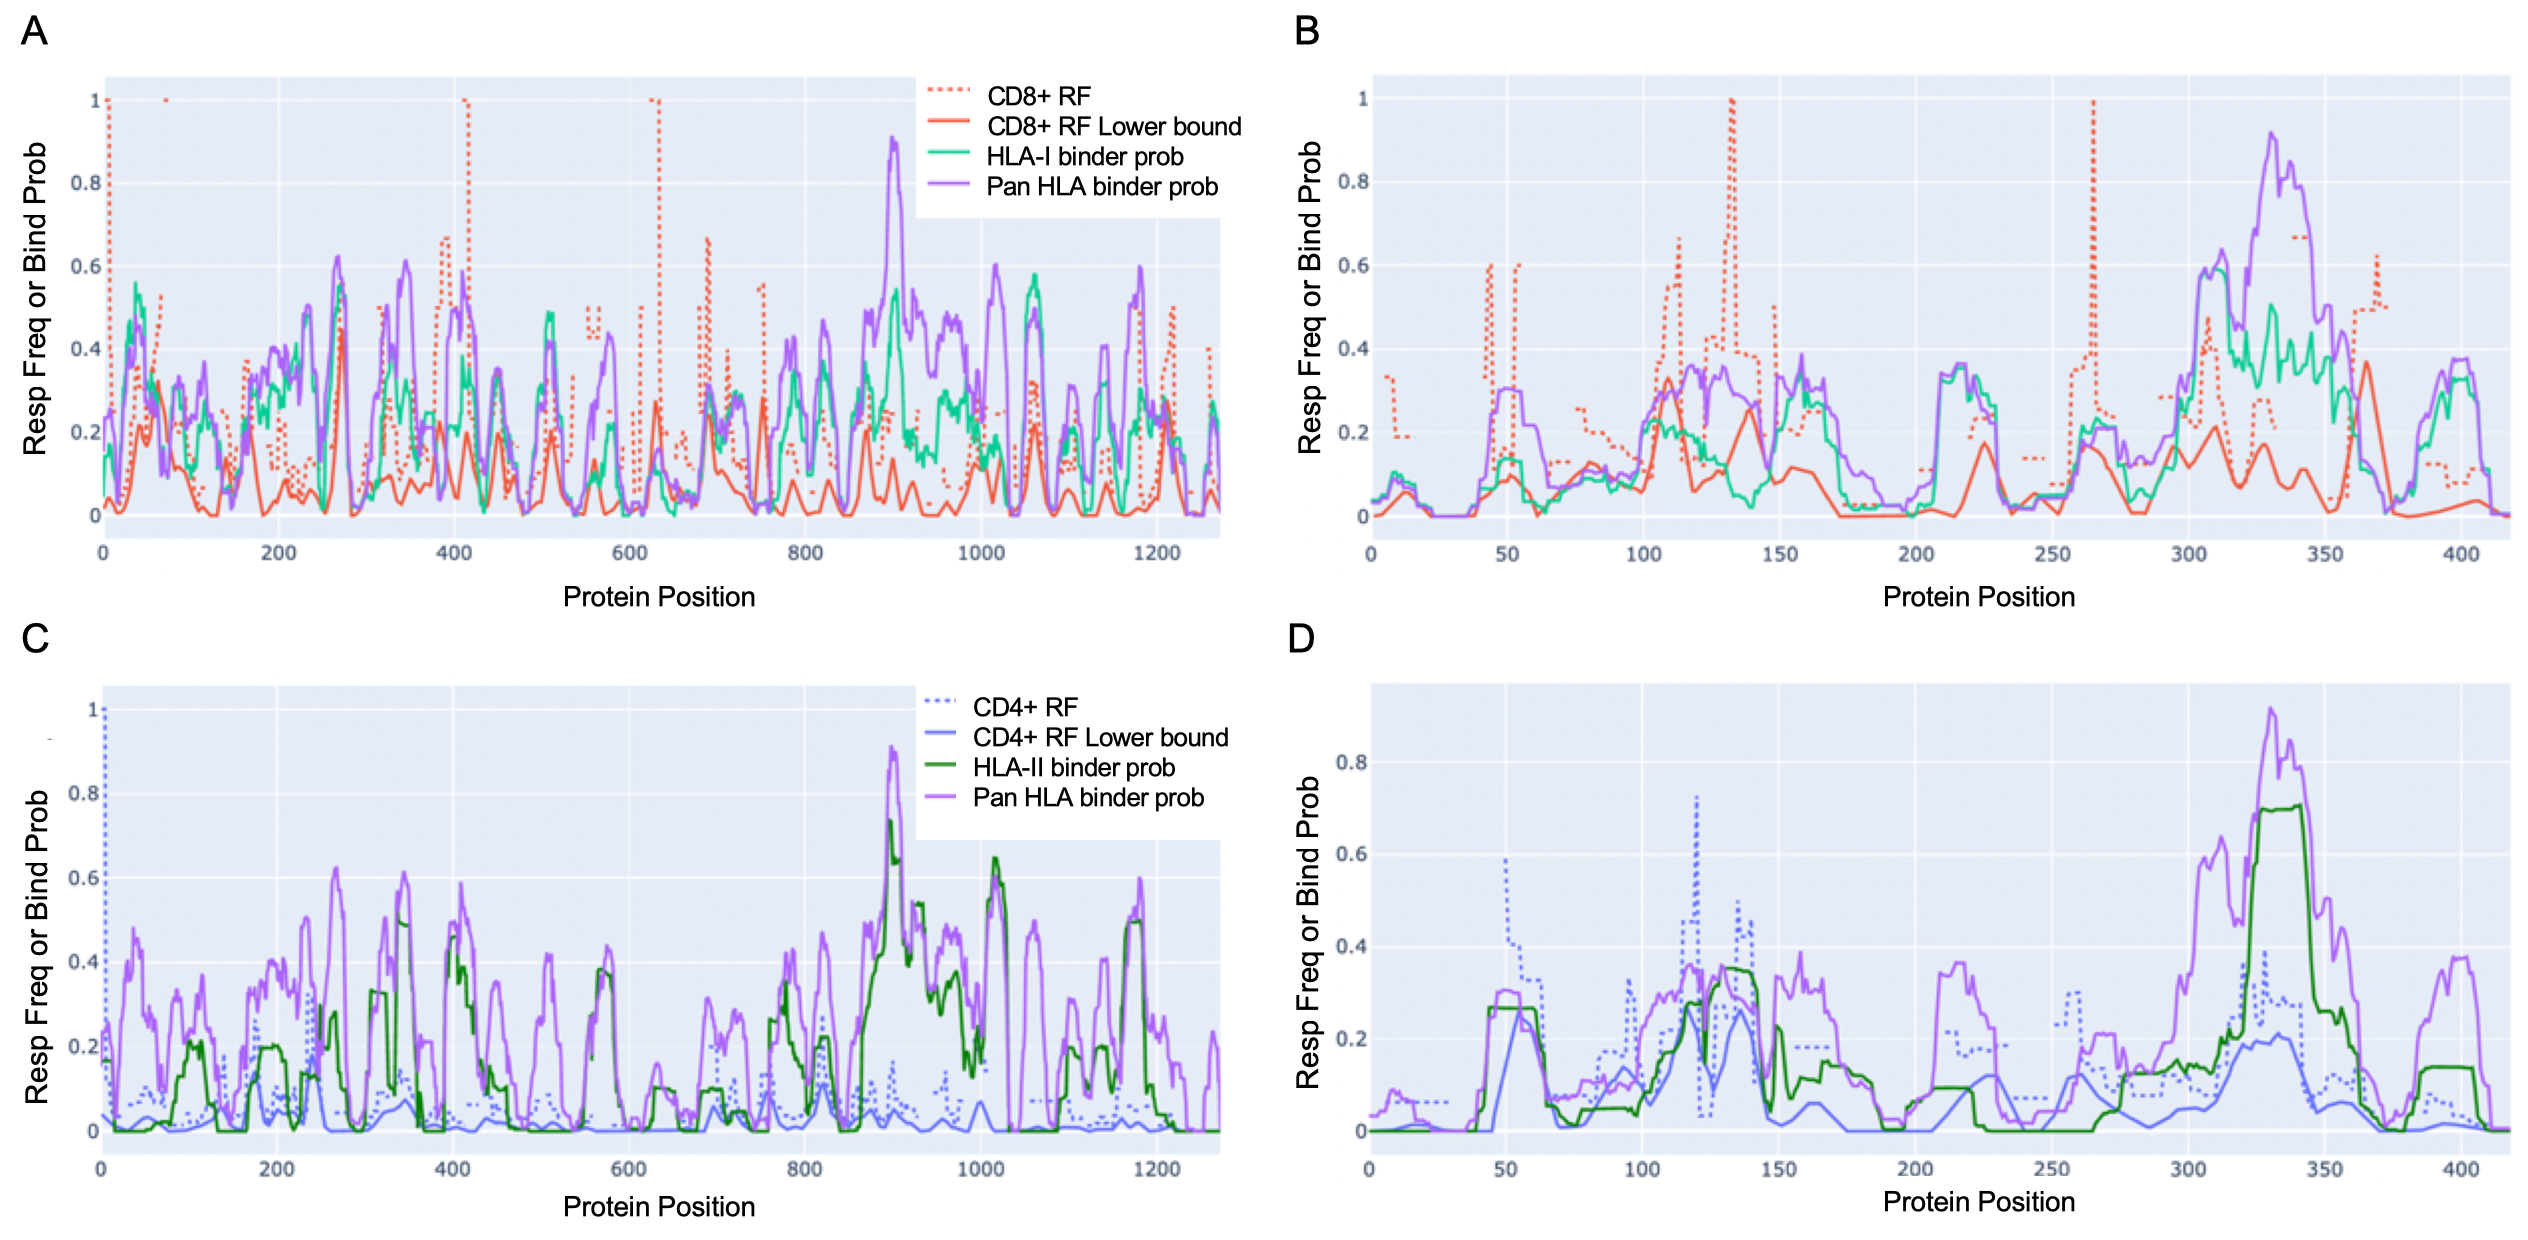
Each of the sub-figures can be accessed as a separate interactive file below. Click on the legend to toggle which data to display.
- S: CD8+ T cell epitope RF vs. HLA-I & pan-HLA predictions (Fig. 2A)
- N: CD8+ T cell epitope RF vs. HLA-I & pan-HLA predictions (Fig. 2B)
- S: CD4+ T cell epitope RF vs. HLA-II & pan-HLA predictions (Fig. 2C)
- N: CD4+ T cell epitope RF vs. HLA-II & pan-HLA predictions (Fig. 2D)
HLA binding prediction benchmark details
To supplement the published overall mean ROC AUC and PPV of our RNN and CNN across HLAs, we include per-HLA results below:
For each HLA, the table summarizes the sample count (n_pos, n_neg), how many samples were classified as ambiguous by each system (RNN_n_ambig, CNN_n_ambig), and the fraction of the total sample count classified as ambiguous (RNN_n_ambig_fract, CNN_n_ambig_fract). On average, across all HLAs, only 2.2% of samples were excluded as ambiguous by both RNN and CNN systems, with HLAs showing the lowest levels of ambiguous sample counts being at 0.7%, and highest ambiguous sample counts at 6%.
As referenced in our paper, performance metrics of other systems reported for individual HLAs were obtained from Reynisson et al. 2020, Supplementary Table 8.